
Kho bài mẫu
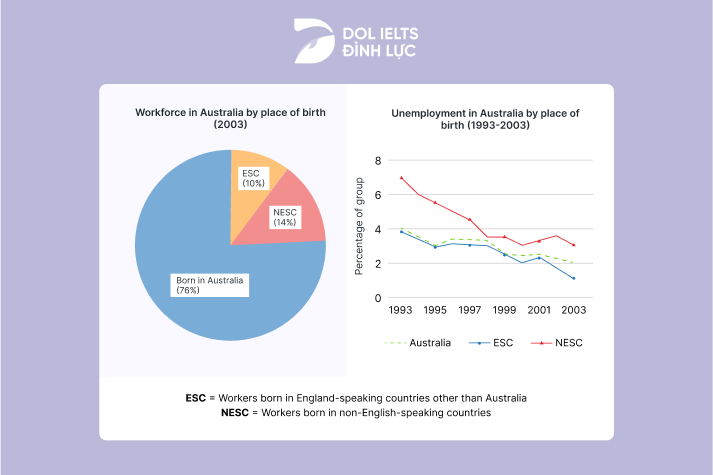
Đề thi IELTS Writing Task 1 ngày 17/02/2024 dạng Mixed Charts: The chart and graph below give information about three categories of workers in Australia and the unemployment levels within those groups. Summarise the information by selecting and reporting the main features, and make comparisons where relevant.
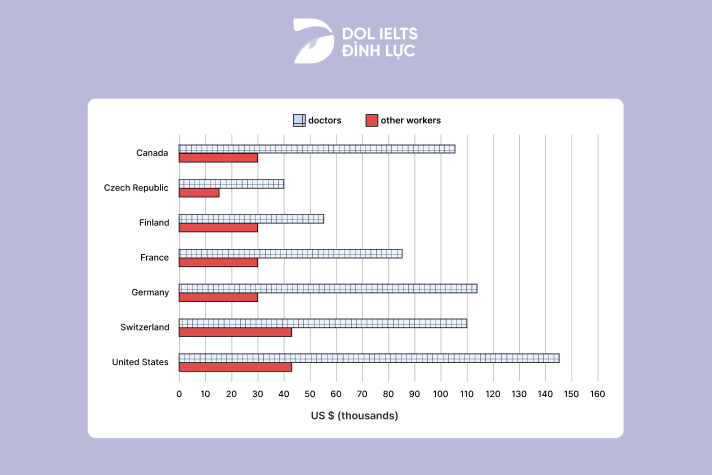
Đề thi IELTS Writing Task 1 ngày 09/12/2023 dạng Bar Chart: The chart below gives information about the average annual pay of doctors and other workers in seven different countries in 2004. Summarize the information by selecting and reporting the main features and make comparisons where relevant.
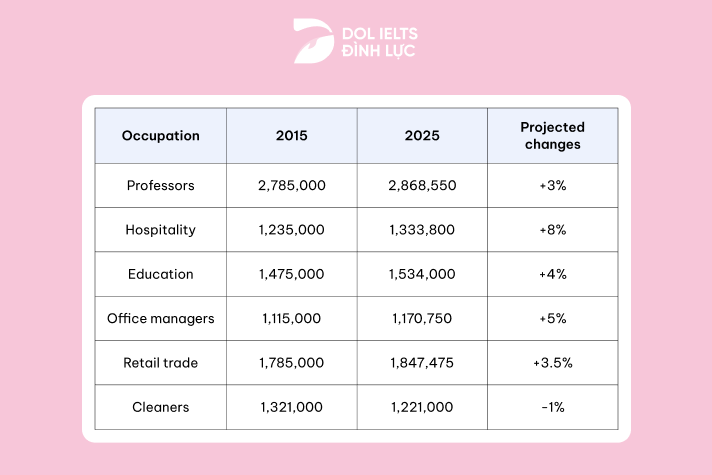
Đề thi IELTS Writing Task 1 ngày 14/12/2023 dạng Table: The table below shows the number of people working different jobs in one country in 2015 and 2025, and its projected changes.
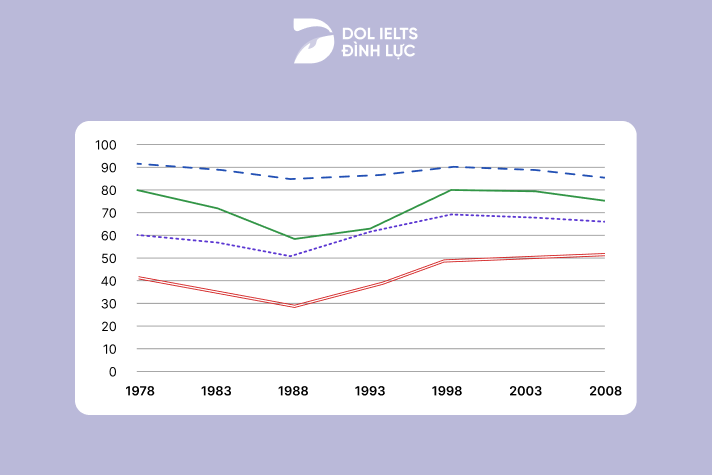
Đề thi IELTS Writing Task 1 ngày 25/11/2023 dạng Line Graph: The graph below shows the percentage of people by age group visiting the cinema at least once per month in one particular country between 1978 and 2008.
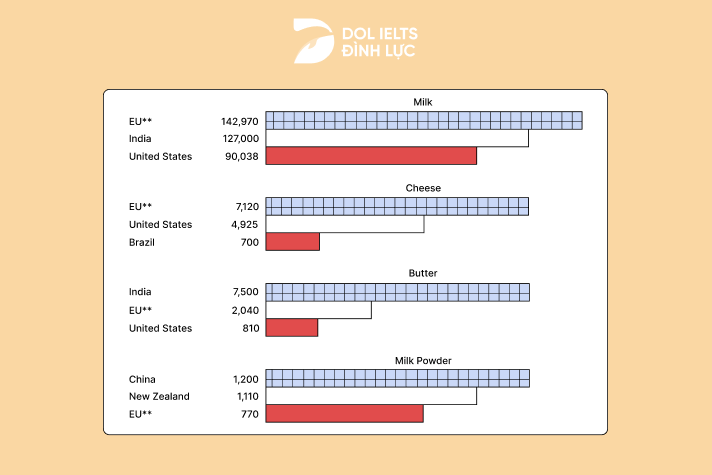
Đề thi IELTS Writing Task 1 ngày 09/11/2023 dạng Mixed Charts: The charts below give information about the world's top three producers for four different dairy products (milk, cheese, butter, milk powder) in the year of 2012.
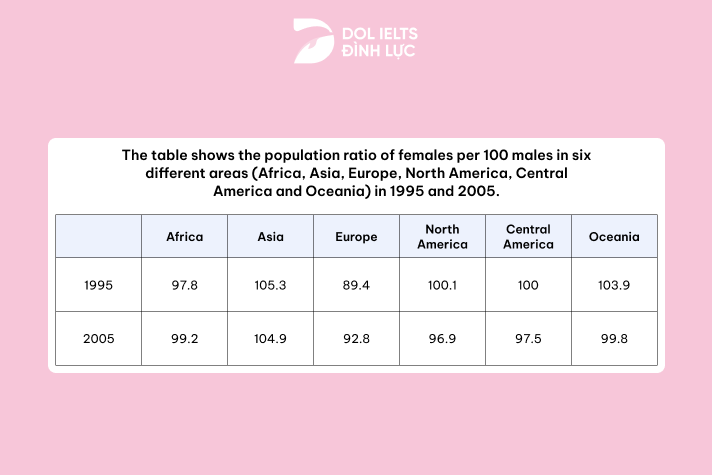
Đề thi IELTS Writing Task 1 ngày 04/11/2023 dạng Table: The table shows the population ratio of females per 100 males in six different areas (Africa, Asia, Europe, North America, Central America, and Oceania) in 1995 and 2005. Summarize and report key features.
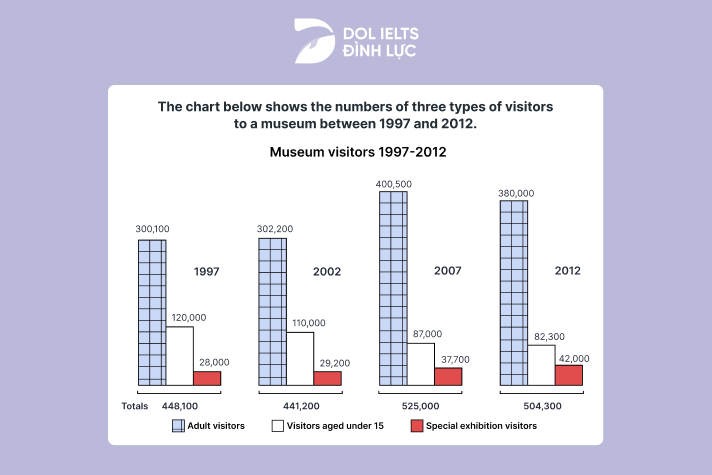
Đề thi IELTS Writing Task 1 ngày 23/09/2023 dạng Line Graph: The chart below shows the numbers of three types of visitors to a museum between 1997 and 2012.
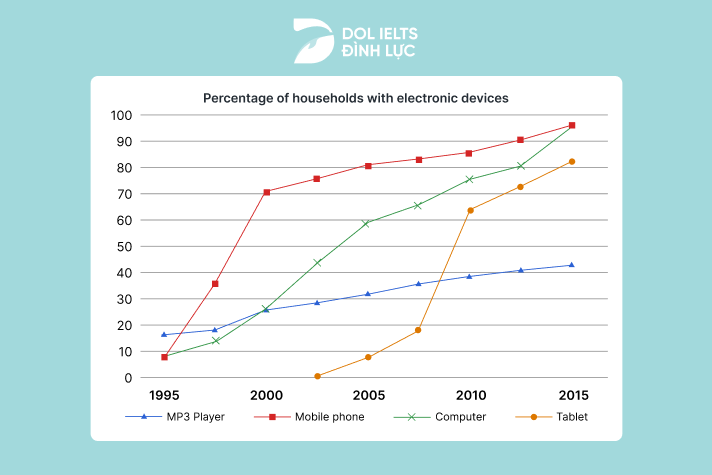
Đề thi IELTS Writing Task 1 ngày 16/09/2023 dạng Line Graph: The chart below shows the percentage of households owning four types of electronic devices between 1995 and 2015.
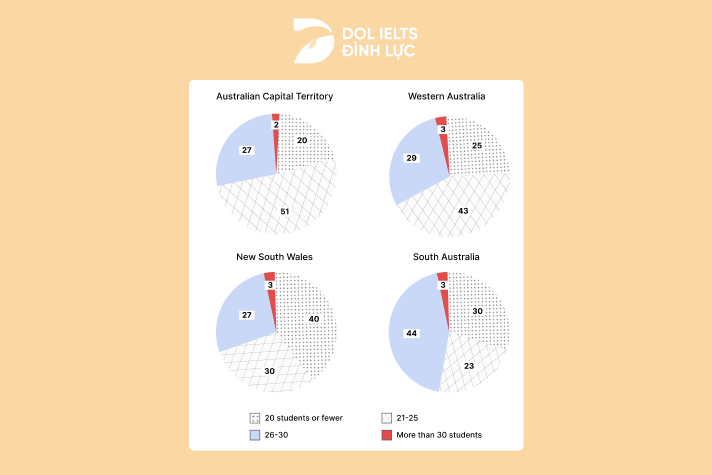
Đề thi IELTS Writing Task 1 ngày 14/09/2023 dạng Pie Chart: The charts below show the class size of four states of Australia.