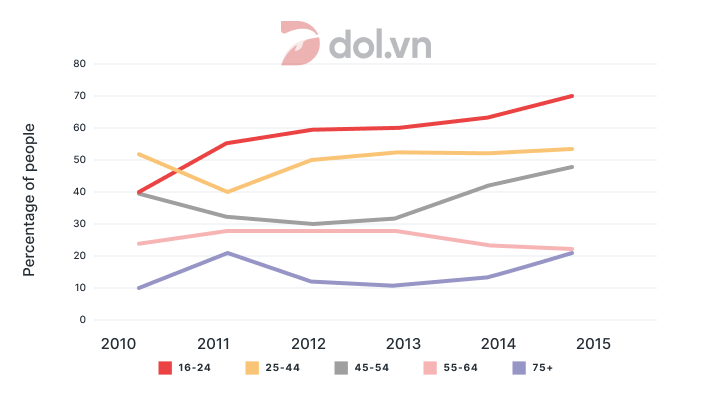
Percentage of people in different age groups attending music concert between 2010 and 2015
Đề thi IELTS Writing Task 1 ngày 05/03/2020 dạng Line graph: The graph below shows the percentage of people in different age groups in one city who attended music concert between 2010 and 2015. Ở bài viết này DOL sẽ viết 1 sample IELTS Writing được 8.0 kèm với 1 số từ vựng và cấu trúc hay trong bài. Chúc các bạn học IELTS vui vẻ cùng dol.vn.

🚀 Đề bài
😵 Dàn ý
DOL sẽ miêu tả biểu đồ với 1 câu mở bài (Intro), 1 đoạn miêu tả tổng quát (Overview), và 2 đoạn thân bài miêu tả chi tiết (Detailed Description)
Mở bài: DOL sẽ paraphrase lại đề bài để giới thiệu lại đề bài cho người chấm
Miêu tả tổng quát: DOL sẽ chỉ ra các đặc điểm quan trọng, nổi bật nhất trong biểu đồ
Thân bài: Vì đây là dạng bài có số liệu thay đổi qua nhiều mốc thời gian, ta sẽ tập trung vào xu hướng tăng giảm của các số liệu
Body 1: Ở đoạn này, DOL sẽ mô tả số liệu khởi điểm của tất cả các hạng mục
Body 2: Tiếp đến, DOL sẽ mô tả xu hướng tăng giảm của các nhóm tuổi sau 5 năm
- People from 25-44 age group - more than half
- 16 to 24 and 45-54 groups - at 40%
- 55-64 group (25%)
- Over-75 group (only 10%)
- Enjoyed a steady upward trajectory, amounting to 70%
- Albeit experiencing a sudden drop of 12%, recovered and eventually reached its initial high of 53% in 2015
- Followed suit with a small slump of 10% and a recovery to reach its peak of 48%
- Recorded a negligible climb of 2% from 2011 to 2014 and a drop to 24% in 2015
- Hit a peak of 21% in 2011 and a dip in 2012 before reaching a high again of 21%
📝 Bài mẫu
The line graph
Overall, it is evident that the older people were, the less likely they enjoyed music concerts as most attendees were from
In 2010, more than half of the surveyed people from 25-44 participated in music concerts, far higher than the figures for 16 to 24 and 45-54 groups (at 40%), the 55-64 group (25%) and over-75 group (only 10%).
Over the next five years, the proportion of participants aged 16 to 24
(250 words)
📚 Vocabulary


✨ Bài tập Exercise
Mình cùng làm 2 bài tập sau đây để ôn lại các từ vựng và cấu trúc đã được dùng trong bài Sample nhé!
Exercise 1:
Điền các từ/cụm từ phù hợp vào chỗ trống (dựa vào danh sách từ vựng phía trên)
Lên đến 70%
=>
Đạt tới mức cao nhất ở 48%
=> Reach its
Tăng nhẹ 2%
=> A
Đạt một mức cao ở 21%
=> Reach a
Tăng dần lên
=> Enjoy a
Cho thấy sự gia tăng trong tỷ lệ
=> Show an
Exercise 2:
Which is the synonym for 'detail'?
calculate
0% chọn
escape
0% chọn
delineate
0% chọn
The surveyed participants are classified ____ five groups.
Which is the synonym for 'consecutive'?
Which is the synonym for 'age group'?
In 2005, the figure for A was 200,000. In 2010, it was 150,000.
=> The figure for A experienced a dip ___ 50,000.
In 2005, the figure for A was 200,000. In 2010, it was 150,000.
=> The figure for A dropped ___ 50,000.
Bài mẫu hay tháng 03/2020.
Tham khảo thêm một số bài Writing IELTS mẫu do Dol biên soạn tại chuyên trang Bài mẫu IELTS Writing Task 1.
💡 Lời kết
Tới đây là hết rồi  Sau sample "The graph below shows the percentage of people in different age groups in one city who attended music concert between 2010 and 2015." vừa rồi, DOL mong các bạn không chỉ nắm được cách trả lời cho dạng bài Line graph, mà còn học được những từ vựng và cấu trúc hay để miêu tả các biểu đồ tương tự nhé.
Nếu có thời gian thì nhớ làm phần bài tập và tự mình viết một bài khác nha vì 'Practice makes perfect' mà nhỉ? DOL chúc các bạn học tốt! 
Bài viết khác
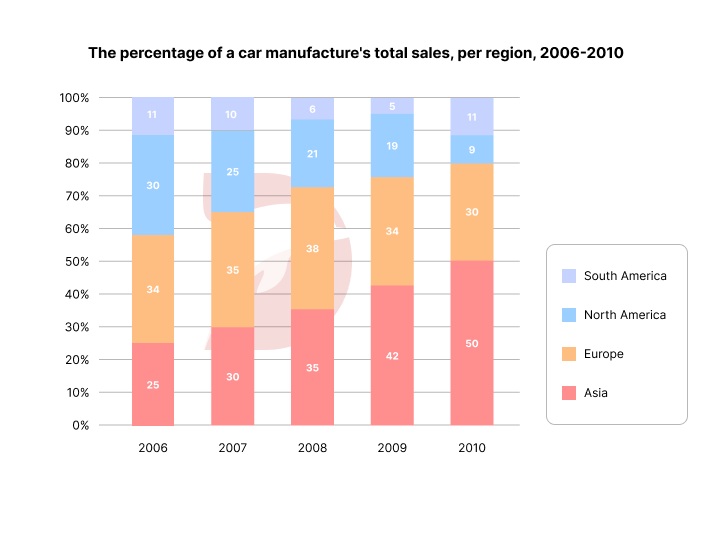
Đề thi IELTS Writing Task 1 ngày 16/03/2024 dạng Bar chart: The chart below shows the percentage of a car manufacturer’s total sales in various regions from 2006 to 2010. Summarise the information by selecting and reporting the main features, and make comparisons where relevant.
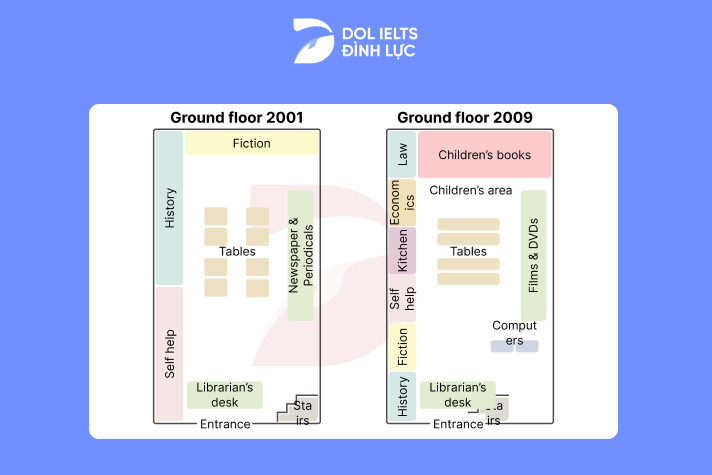
Đề thi IELTS Writing Task 1 ngày 09/03/2024 dạng Map: The plans below show the ground floor of a library in 2001 and how it was developed in 2009. Summarise the information by selecting and reporting the main features, and make comparisons where relevant.
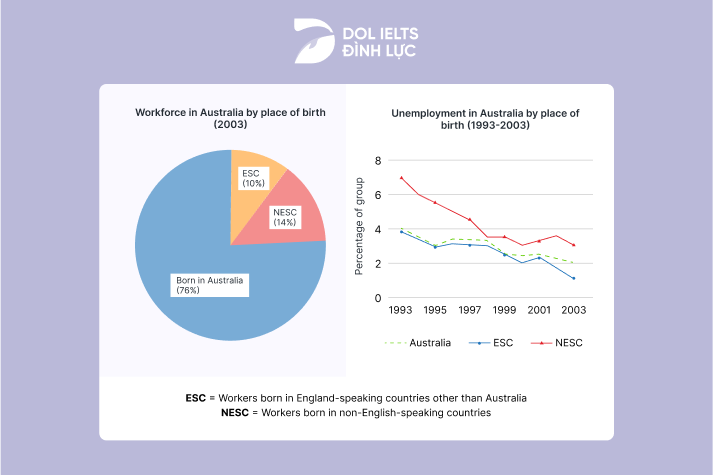
Đề thi IELTS Writing Task 1 ngày 17/02/2024 dạng Mixed Charts: The chart and graph below give information about three categories of workers in Australia and the unemployment levels within those groups. Summarise the information by selecting and reporting the main features, and make comparisons where relevant.
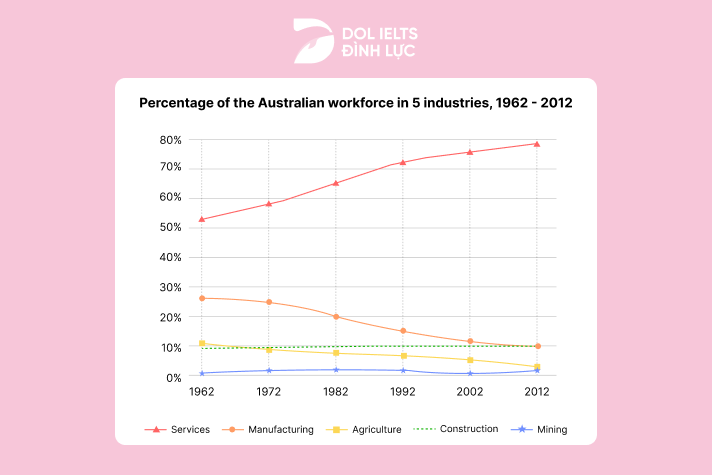
Đề thi IELTS Writing Task 1 ngày 07/03/2024 dạng Line graph: The graph below shows the percentage of the Australian workforce in five industries between 1962 and 2012. Summarise the information by selecting and reporting the main features, and make comparisons where relevant.
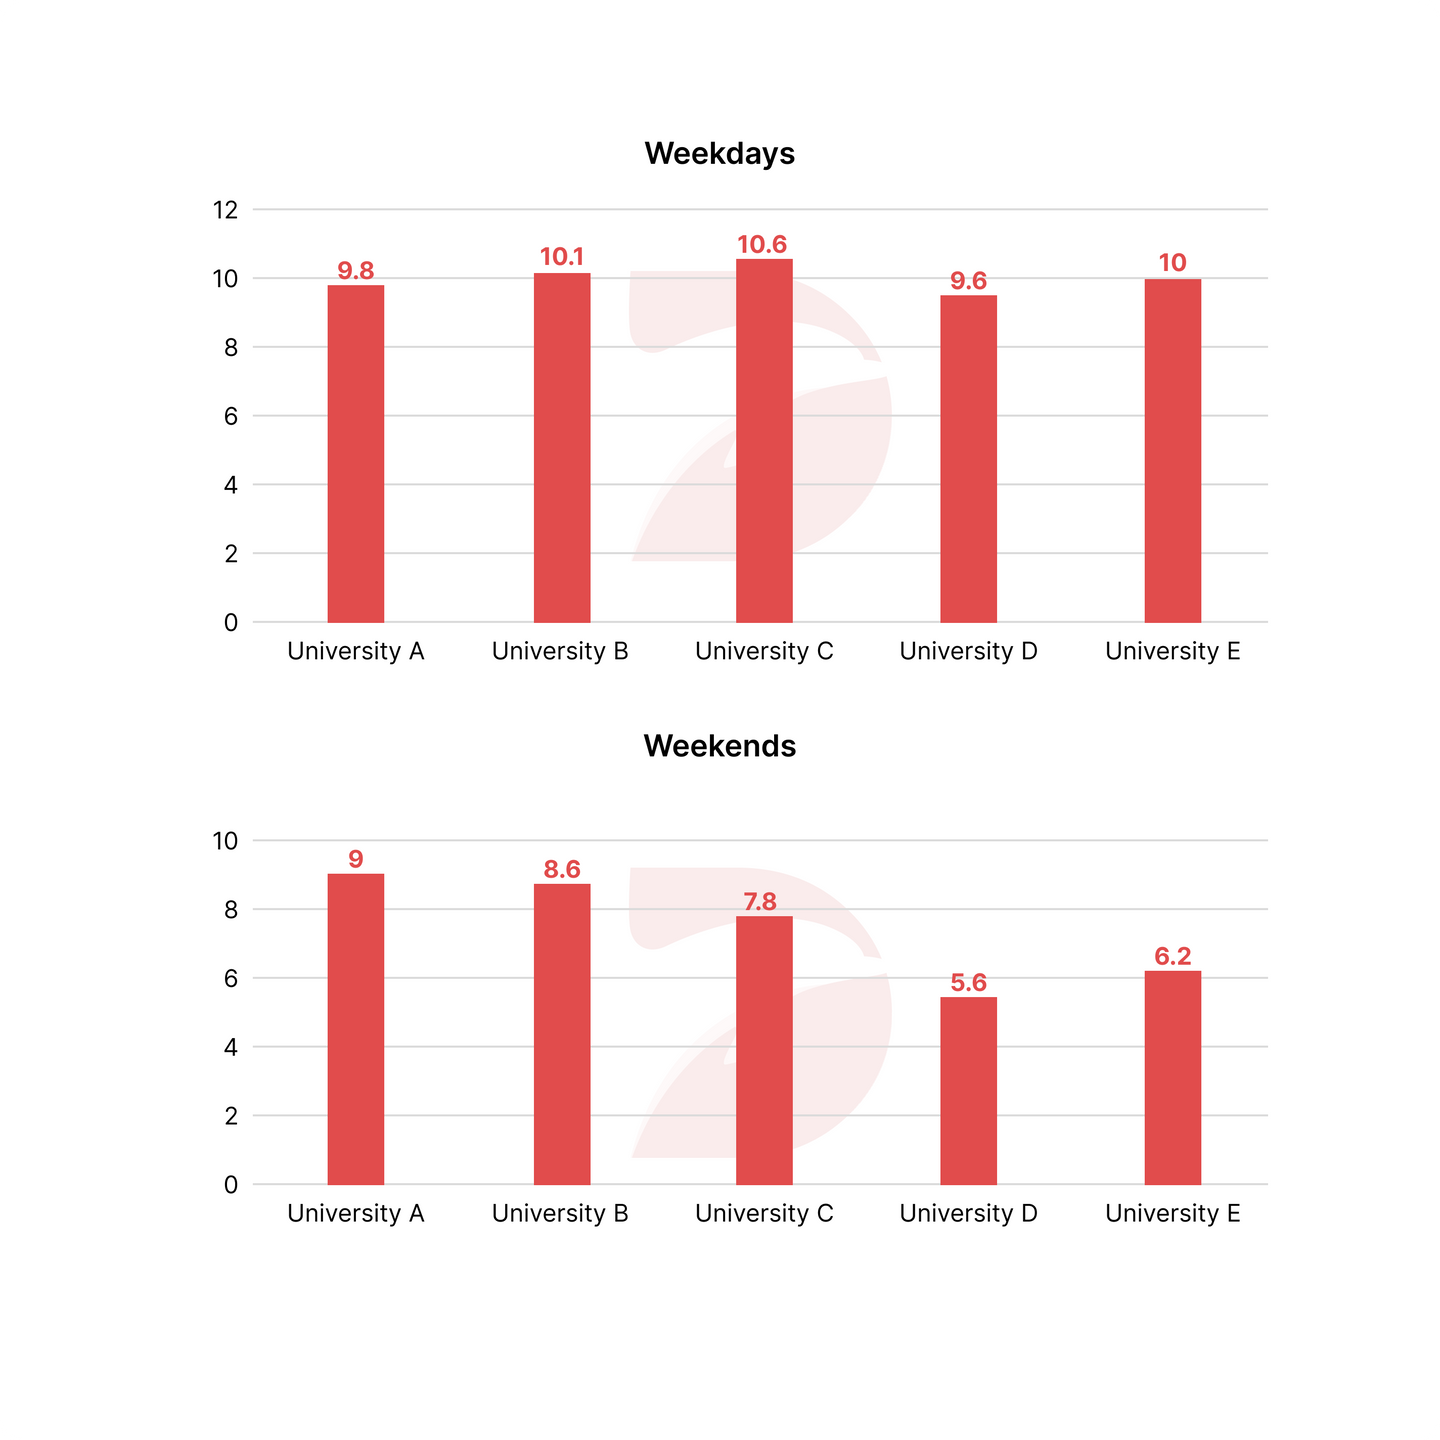
Đề thi IELTS Writing Task 1 ngày 18/04/2024 dạng Bar chart: The bar chart shows the average number of hours students in five different universities studied.