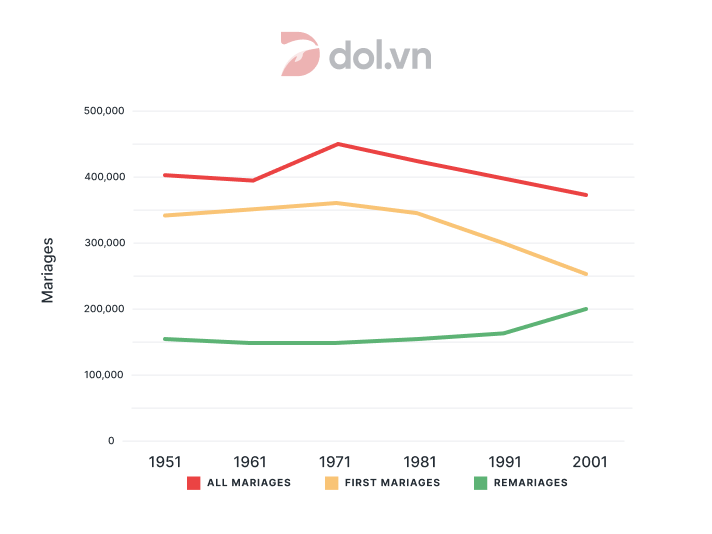
The number of marriages in the UK from 1951 to 2001
Đề thi IELTS Writing Task 1 ngày 17/06/2021 dạng Line graph: The graph shows the information about the number of marriages in the UK from 1951 to 2001. Ở bài viết này DOL sẽ viết 1 sample IELTS Writing được 8.0 kèm với 1 số từ vựng và cấu trúc hay trong bài. Chúc các bạn học IELTS vui vẻ cùng DOL.

🚀 Đề bài
😵 Dàn ý
DOL sẽ miêu tả biểu đồ với 1 câu mở bài (Intro), 1 đoạn miêu tả tổng quát (Overview), và 2 đoạn thân bài miêu tả chi tiết (Detailed Description)
Mở bài: DOL sẽ paraphrase đề bài để giới thiệu lại đề bài cho người chấm
Miêu tả tổng quát: DOL sẽ chỉ ra các đặc điểm quan trọng, nổi bật nhất trong biểu đồ
Thân bài: Vì đây là dạng bài có số liệu thay đổi qua nhiều mốc thời gian, ta sẽ tập trung vào xu hướng tăng giảm của các số liệu
Body 1: Đầu tiên, DOL sẽ phân tích số liệu của hạng mục 'All marriages'
Body 2: Tiếp đến, DOL phân tích số liệu của 2 hạng mục còn lại. DOL phân tích 2 hạng mục này cùng nhau vì thấy có sự tương đồng cũng như trái ngược nhau trong xu hướng
- Starting at 400,000 in 1951
- Fell slightly in 1961
- Peaked in 1971
- Decreased to 370,000 by the end of the period
- Increased slightly from 1951 to 1971
- Declined to 250,000 by the end of the period
- Remained stable between 1951 and 1981
- Increased sharply and peaked at 200,000 in 2001
📝 Bài mẫu
The provided line graph presents how many marriages there were in the UK between 1951 to 2001.
In general, the total number of all marriages in the UK
Starting at 400,000 in 1951, the total number of all marriages
In terms of first marriages, there was a slight increase in its count from 1951 to 1971. However, over the next thirty years, there was
(159 words)
📚 Vocabulary


✨ Bài tập Exercise
Mình cùng làm 2 bài tập sau đây để ôn lại các từ vựng và cấu trúc đã được dùng trong bài IELTS Writing Task 1 Sample Essay nhé!
Exercise 1:
Which is the synonym for 'mild'?
slight
0% chọn
sharp
0% chọn
steep
0% chọn
After peaking ____ 20,000, the figure for Singapore witnessed a mild drop.
Which is the antonym for 'a steep decline'?
Exercise 2:
1 Hầu hết các danh mục đều có xu hướng giảm.
=> Most of the categories
2 Do đại dịch, doanh thu của công ty tôi sụt giảm nghiêm trọng.
=> Due to the pandemic, my company's revenue
3 Con số này của Thái Lan vẫn ổn định trong hai năm đầu tiên trước khi tăng vọt lên 60%.
=> The figure for Thailand
Học từ vựng hay qua Writing task 2 IELTS Sample ngày 05/06/2021 ngay nhé.
Những bài mẫu task 1 chọn lọc tháng 06/2021.
Đừng bỏ lỡ những bài mẫu IELTS Writing chất lượng trên website DOL nhé.
💡 Lời kết
Tới đây là hết rồi  Sau sample "The graph shows the information about the number of marriages in the UK from 1951 to 2001.", DOL mong các bạn không chỉ nắm được cách trả lời cho dạng bài Line graph, mà còn học được những từ vựng và cấu trúc hay để miêu tả các biểu đồ tương tự nhé.
Nếu có thời gian thì nhớ làm phần bài tập và tự mình viết một bài khác nha vì 'Practice makes perfect' mà nhỉ? DOL chúc các bạn học tốt! 
Bài viết khác
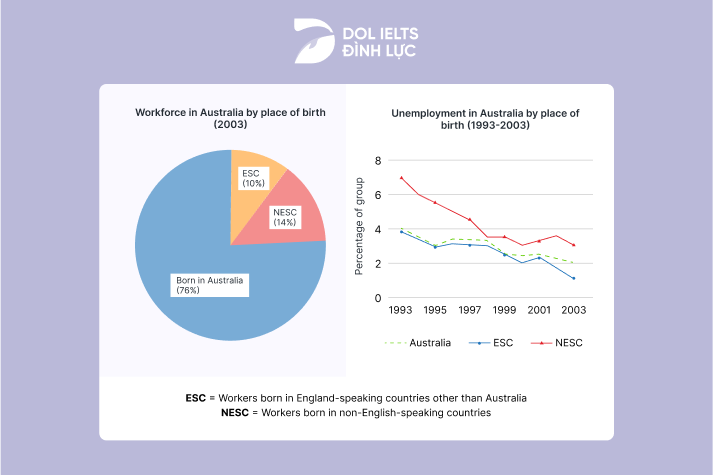
Đề thi IELTS Writing Task 1 ngày 17/02/2024 dạng Mixed Charts: The chart and graph below give information about three categories of workers in Australia and the unemployment levels within those groups. Summarise the information by selecting and reporting the main features, and make comparisons where relevant.
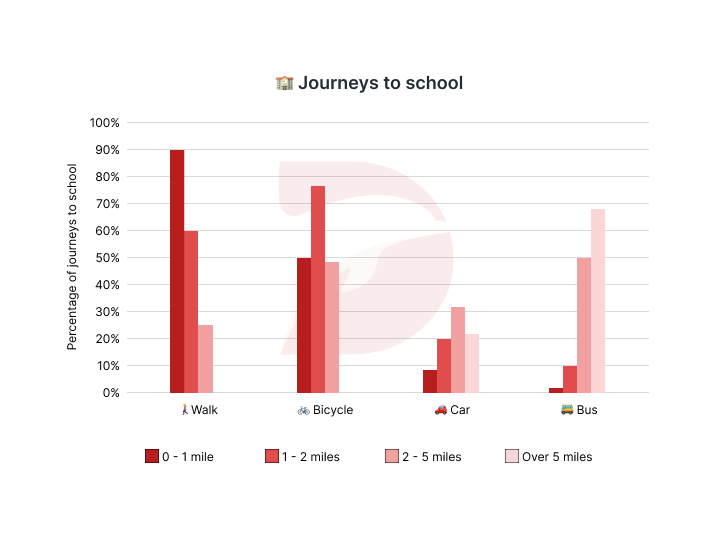
Đề thi IELTS Writing Task 1 ngày 13/04/2024 dạng Bar chart: The chart below gives information about the journeys to school by children aged 11 to 16 in the UK in a year. Summarise the information by selecting and reporting the main features, and make comparisons where relevant.
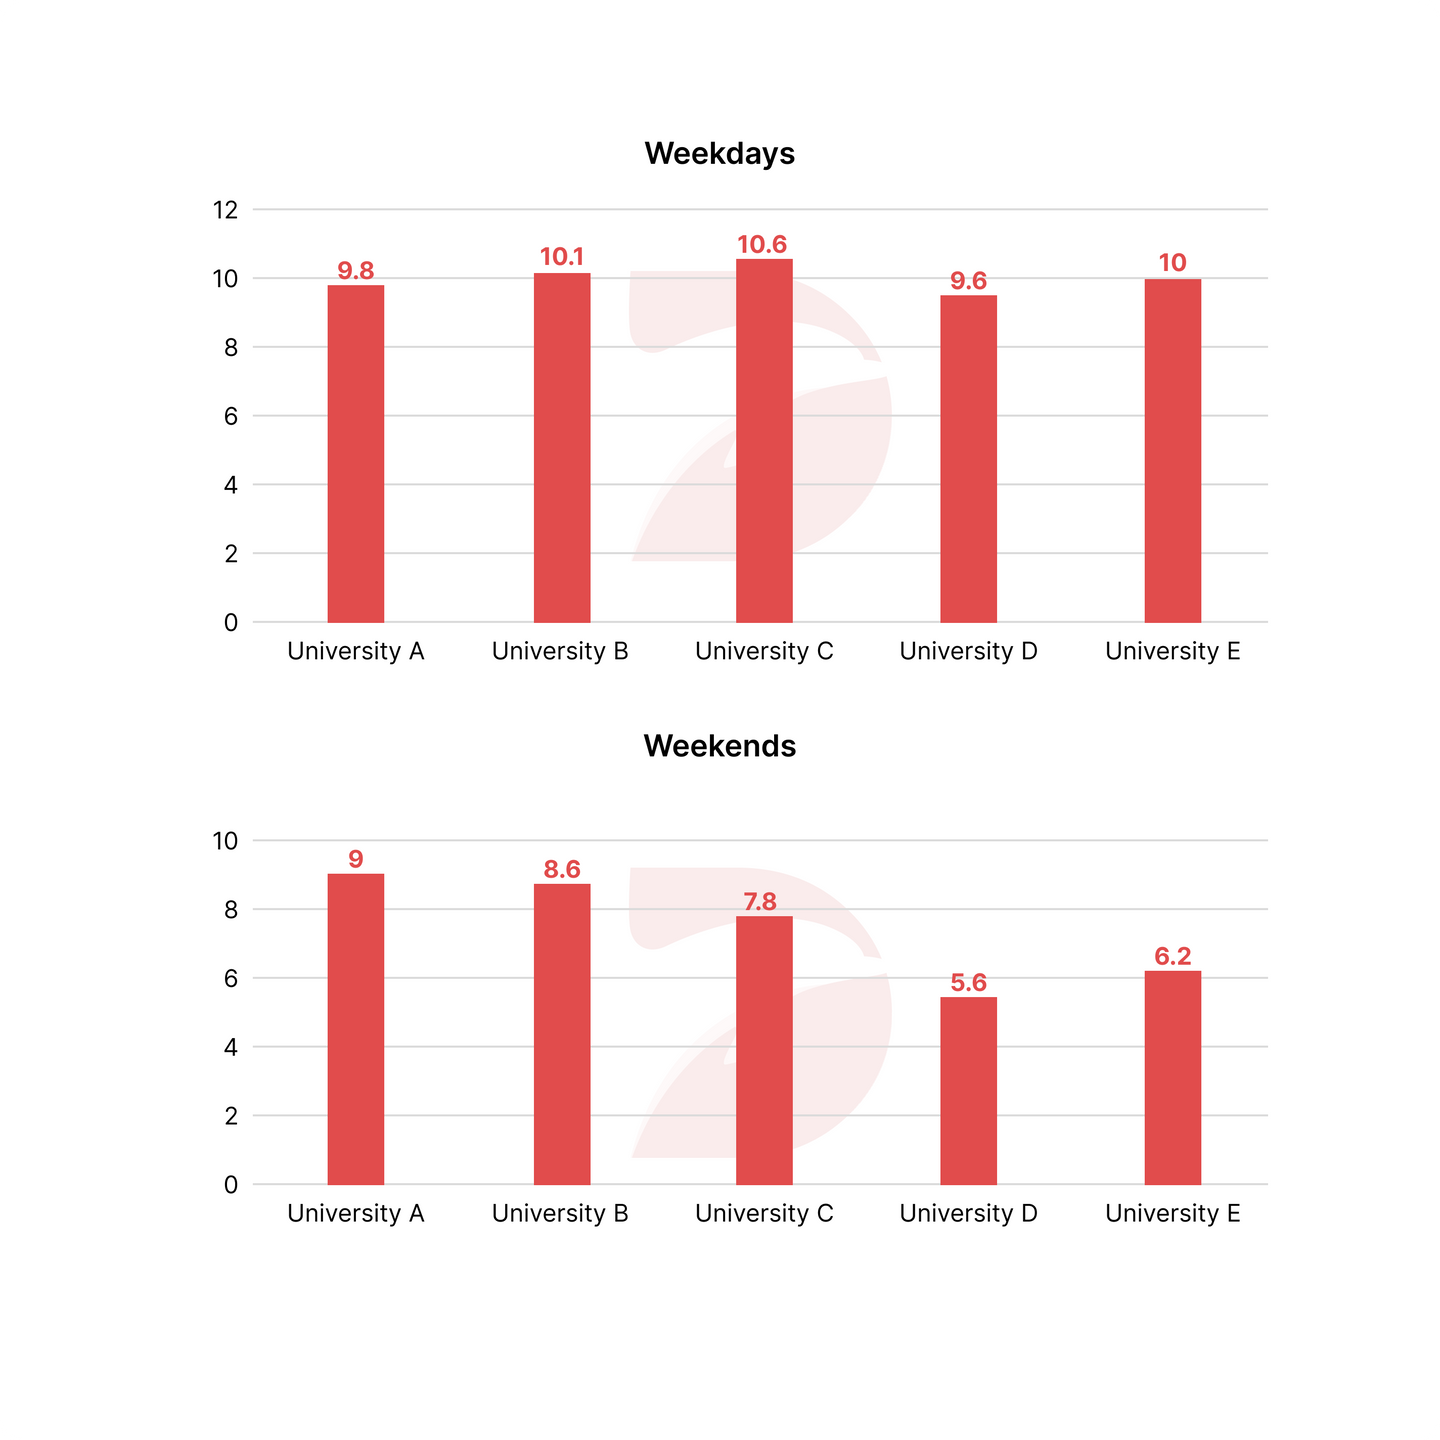
Đề thi IELTS Writing Task 1 ngày 18/04/2024 dạng Bar chart: The bar chart shows the average number of hours students in five different universities studied.
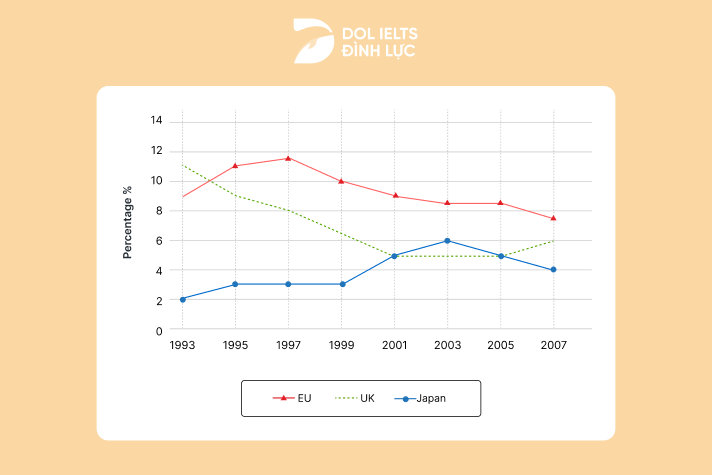
Đề thi IELTS Writing Task 1 ngày 24/02/2024 dạng Line graph: The graph below shows the unemployment rates for the United Kingdom, the rest of Europe, and Japan from 1993 to 2007.
Đề thi IELTS Writing Task 1 ngày 07/03/2024 dạng Line graph: The graph below shows the percentage of the Australian workforce in five industries between 1962 and 2012. Summarise the information by selecting and reporting the main features, and make comparisons where relevant.