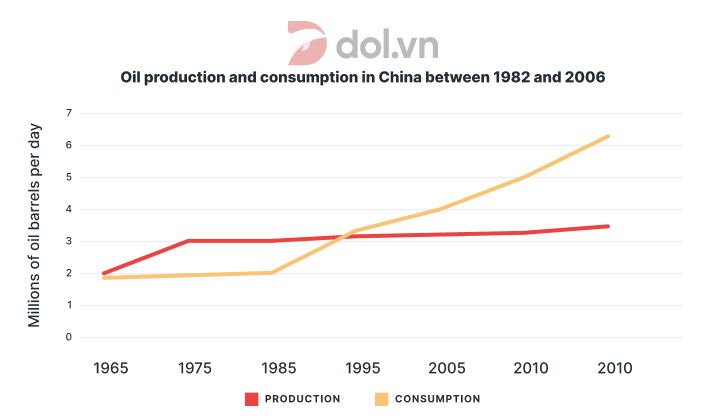
The line graph shows the oil production and consumption
Đề thi IELTS Writing Task 1 ngày 02/08/2018: The line graph below shows the oil production and consumption in China between 1982 and 2006. Ở bài viết này DOL sẽ viết 1 sample IELTS Writing được 8.0 kèm với 1 số từ vựng và cấu trúc hay trong bài. Chúc các bạn học IELTS vui vẻ cùng dol.vn.

🚀 Đề bài
😵 Dàn ý
DOL sẽ miêu tả biểu đồ với một câu mở bài (Intro) kèm phần miêu tả tổng quát (Overview), và 2 đoạn thân bài miêu tả chi tiết (Detailed Description)
Mở bài: DOL sẽ paraphrase lại đề bài để giới thiệu lại đề bài cho người chấm, sau đó viết phần Overview để miêu tả các chi tiết quan trọng, nổi bật nhất trong biểu đồ
Thân bài: Vì đây là dạng bài có số liệu thay đổi theo từng năm, ta sẽ tập trung vào sự tăng giảm của các số liệu
Body 1: Đầu tiên, DOL sẽ mô tả và so sánh số liệu cũng như xu hướng của nửa đầu chu kỳ
Body 2: Tiếp đến, DOL sẽ mô tả số liệu ở nửa cuối chu kỳ.
- The amount of oil production and consumption in China was the same, at around 2 millions of barrels per day.
- Consumption remained stagnant, production had outstripped by 1 millions barrels
- Oil usage had multiplied one and a half times, from 2 million to 3.5 million, outstripped production
📝 Bài mẫu
The line group demonstrates
In 1982, the amount of oil production and consumption in China were almost
Furthermore, consumption continued to
(151 words)
📚 Vocabulary


✨ Bài tập Exercise
Mình cùng làm 2 bài tập sau đây để ôn lại các từ vựng và cấu trúc đã được dùng trong bài Sample nhé!
Exercise 1:
If a figure stays at the same level over a period of time, we can say that it
To
If consumption of a product
If the figure for A exceeds that of B, we can say that A
If a category experiences
Exercise 2:
Biểu đồ đường cho thấy sản lượng và mức độ tiêu thụ dầu từ năm 1982 đến 2006.
=> The line group demonstrates the
Sản lượng dậm chân tại chỗ và chỉ tăng lên 3.5 triệu thùng trong cùng năm đó.
=> Production remained stagnant, and had only
Việc sử dụng nước của người dân chiếm phần lớn nhất trong tổng lượng nước tiêu thụ.
=> Residential use held the lion’s share of
Chinh phục Writing task 1 tháng 08/2018.
Bấm vào Trang tổng hợp bài mẫu Writing Task 1 để tiếp cận những bài Writing IELTS mẫu do Dol biên soạn.
💡 Lời kết
Tới đây là hết rồi  Sau sample "The line graph below shows the oil production and consumption in China between 1982 and 2006" vừa rồi, DOL mong các bạn không chỉ nắm được cách trả lời cho dạng bài Line graph, mà còn học được những từ vựng và cấu trúc hay để miêu tả các biểu đồ tương tự nhé.
Nếu có thời gian thì nhớ làm phần bài tập và tự mình viết một bài khác nha vì 'Practice makes perfect' mà nhỉ? DOL chúc các bạn học tốt! 
Bài viết khác
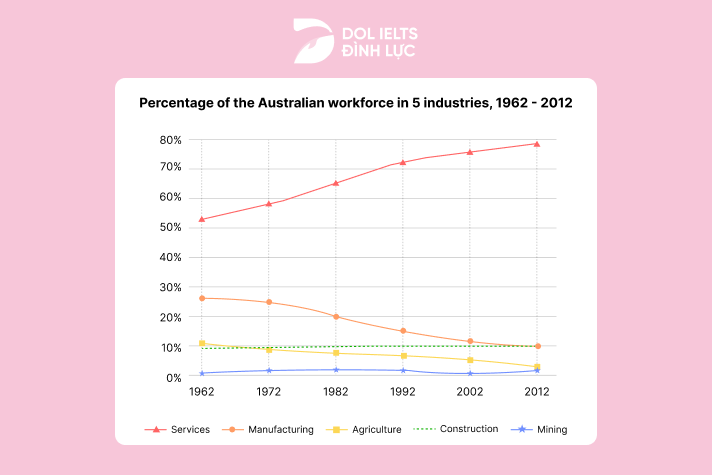
Đề thi IELTS Writing Task 1 ngày 07/03/2024 dạng Line graph: The graph below shows the percentage of the Australian workforce in five industries between 1962 and 2012. Summarise the information by selecting and reporting the main features, and make comparisons where relevant.
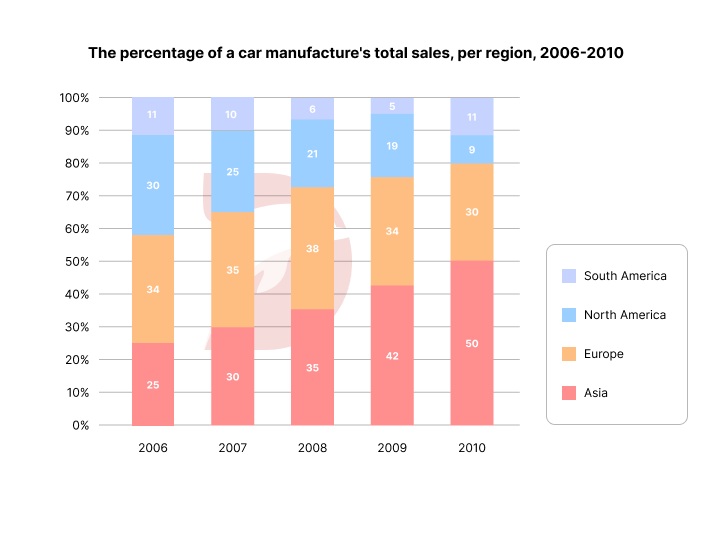
Đề thi IELTS Writing Task 1 ngày 16/03/2024 dạng Bar chart: The chart below shows the percentage of a car manufacturer’s total sales in various regions from 2006 to 2010. Summarise the information by selecting and reporting the main features, and make comparisons where relevant.
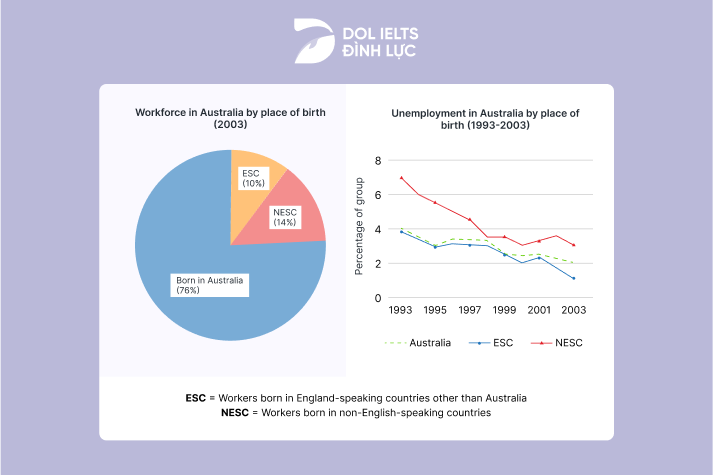
Đề thi IELTS Writing Task 1 ngày 17/02/2024 dạng Mixed Charts: The chart and graph below give information about three categories of workers in Australia and the unemployment levels within those groups. Summarise the information by selecting and reporting the main features, and make comparisons where relevant.
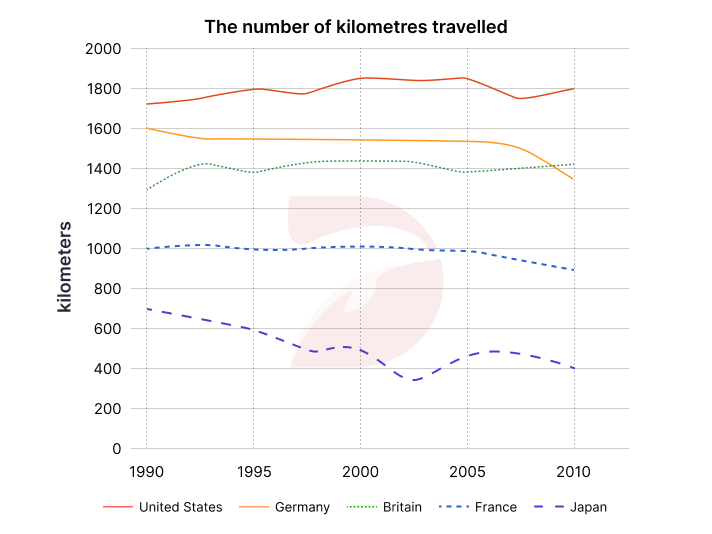
Đề thi IELTS Writing Task 1 ngày 20/04/2024 dạng Line graph: The line graph shows the number of kilometers traveled per car in five countries between 1990 and 2010. Summarise the information by selecting and reporting the main features, and make comparisons where relevant.
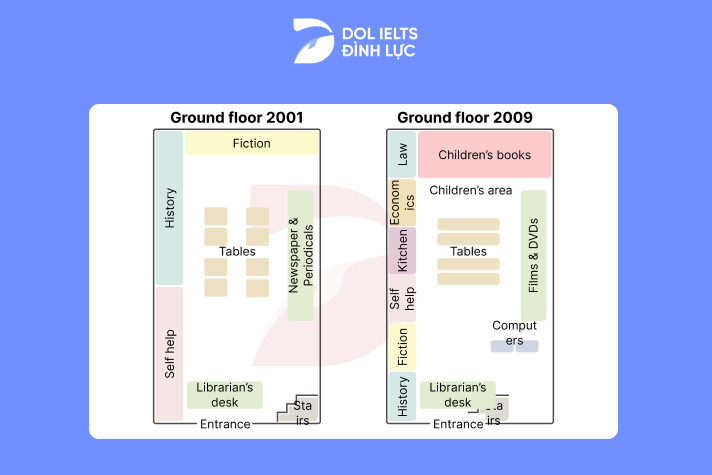
Đề thi IELTS Writing Task 1 ngày 09/03/2024 dạng Map: The plans below show the ground floor of a library in 2001 and how it was developed in 2009. Summarise the information by selecting and reporting the main features, and make comparisons where relevant.