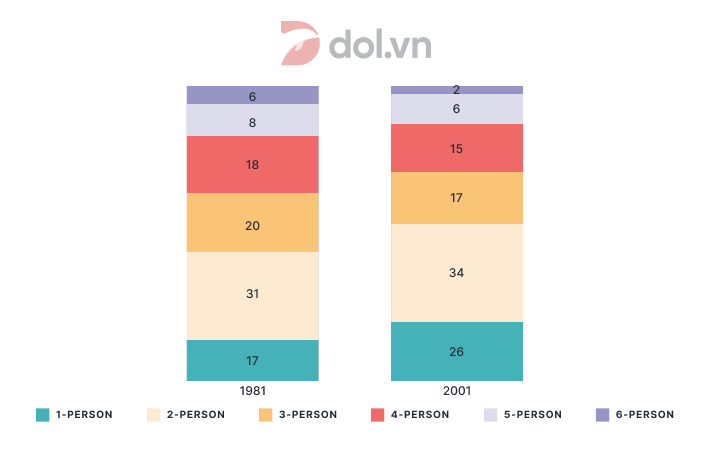
The charts compare the number of people per household in the UK in 1981 and 2001
Đề thi IELTS Writing Task 1 ngày 30/05/2020 dạng Bar chart: The charts compare the number of people per household in the UK in 1981 and 2001. Ở bài viết này DOL sẽ viết 1 sample IELTS Writing được 8.0 kèm với 1 số từ vựng và cấu trúc hay trong bài. Chúc các bạn học IELTS vui vẻ cùng dol.vn.

🚀 Đề bài
😵 Dàn ý
DOL sẽ miêu tả biểu đồ với 1 câu mở bài (Intro), 1 đoạn miêu tả tổng quát (Overview), và 2 đoạn thân bài miêu tả chi tiết (Detailed Description)
Mở bài: DOL sẽ paraphrase lại đề bài để giới thiệu lại đề bài cho người chấm
Miêu tả tổng quát: DOL sẽ chỉ ra các đặc điểm quan trọng, nổi bật nhất trong biểu đồ
Thân bài: Vì đây là dạng bài có số liệu thay đổi qua nhiều mốc thời gian, ta sẽ tập trung vào xu hướng tăng giảm của các số liệu
Body 1: Đầu tiên, DOL sẽ phân tích biểu đồ cột thứ nhất (1981)
Body 2: Tiếp đến, DOL sẽ phân tích biểu đồ cột thứ hai (2001) để cho thấy những thay đổi về mặt số liệu
- 31% of households consisted of 2 occupants
- 3-person households with 20%
- Single and 4-member households account for 17% and 18% in turn
- 8% for 5-occupant and 6% for 6-occupant units
- Households with a single person living alone or two persons became dominant - at 34% and 26% respectively
- Households with 3 or 4 occupants recorded a fall of 3%, finishing at 17% and 15% respectively
- The figures for household units of 5 or 6 members decreased to 6% and 2%
📝 Bài mẫu
The
As is shown in the graph, most households in the UK had 2 occupants. Over
Regarding the first stacked bar, 31% of households consisted of 2 occupants, heading the list of total demographics. Next came 3-person households with 20%, as opposed to single and 4-member households,
20 years later, households with a single person living alone or two persons
(185 words)
📚 Vocabulary


✨ Bài tập Exercise
Mình cùng làm 2 bài tập sau đây để ôn lại các từ vựng và cấu trúc đã được dùng trong bài Sample nhé!
Exercise 1:
Điền các từ/cụm từ phù hợp vào chỗ trống (dựa vào danh sách từ vựng phía trên)
Chiếm 17%
=>
Xếp ở vị trí cuối
=> Rank in
Dẫn đầu danh sách
=>
Ghi nhận một đợt giảm 3%
=>
Trải qua một đợt giảm tương ứng
=> Experience a
Tăng lên
=> Enjoy
Exercise 2:
1 Biểu đồ cột chồng thể hiện tỷ lệ học sinh dựa trên sở thích của họ.
=> The
2 Kết cấu hộ gia đình phổ biển ở Mỹ là gia đình 3 người
=> The common
3 Số lượng thành viên giữa các gia dình được khảo sát khác nhau nhiều.
=> The
4 Giai đoạn được khảo sát là từ năm 2000 tới 2020.
=> The
5 Nhóm đối tượng mục tiêu của chúng ta là phụ nữ thành thị từ 25-30 tuổi với trình độ đại học.
=> Our
6 Những hộ gia đình 1 người trở nên trội hơn vào cuối giai đoạn.
=>
7 Những hộ gia đình 2 người đã trở nên phổ biến hơn.
=>
Bài mẫu hay và chọn lọc tháng 05/2020.
Tham khảo thêm các bài mẫu Writing Task 1 khác tại trang Writing IELTS Samples trên DOL.
💡 Lời kết
Tới đây là hết rồi  Sau sample "The charts compare the number of people per household in the UK in 1981 and 2001" vừa rồi, DOL mong các bạn không chỉ nắm được cách trả lời cho dạng bài Bar chart, mà còn học được những từ vựng và cấu trúc hay để miêu tả các biểu đồ tương tự nhé.
Nếu có thời gian thì nhớ làm phần bài tập và tự mình viết một bài khác nha vì 'Practice makes perfect' mà nhỉ? DOL chúc các bạn học tốt! 
Bài viết khác
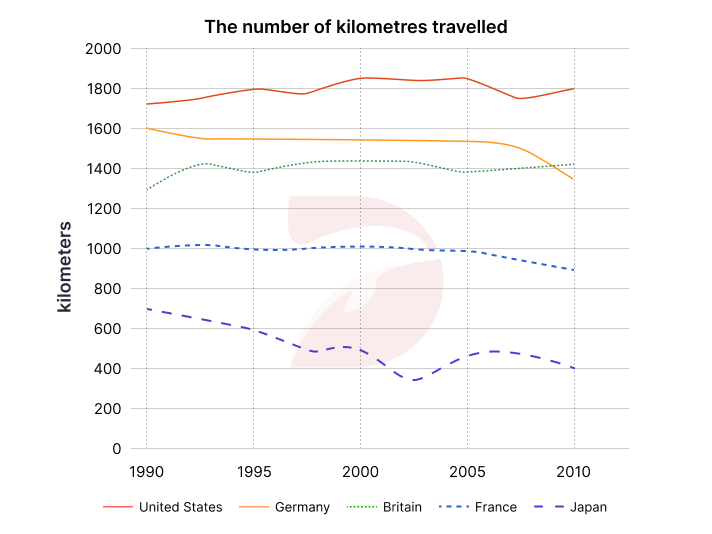
Đề thi IELTS Writing Task 1 ngày 20/04/2024 dạng Line graph: The line graph shows the number of kilometers traveled per car in five countries between 1990 and 2010. Summarise the information by selecting and reporting the main features, and make comparisons where relevant.
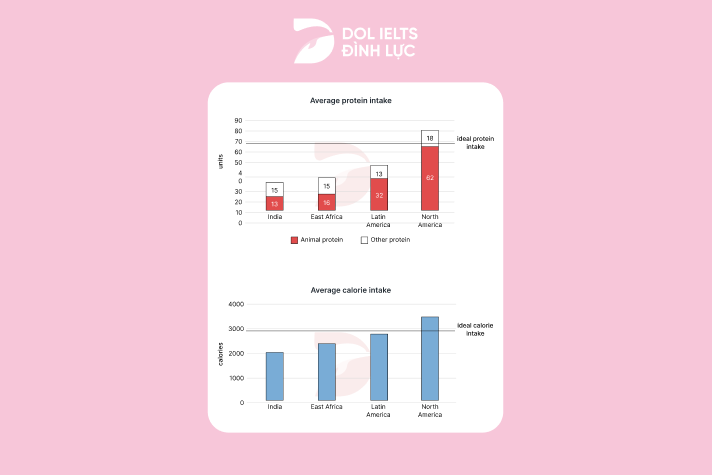
Đề thi IELTS Writing Task 1 ngày 23/03/2024 dạng Bar chart: The charts below show the protein and calorie intakes of people in different parts of the world. Summarise the information by selecting and reporting the main features, and make comparisons where relevant.
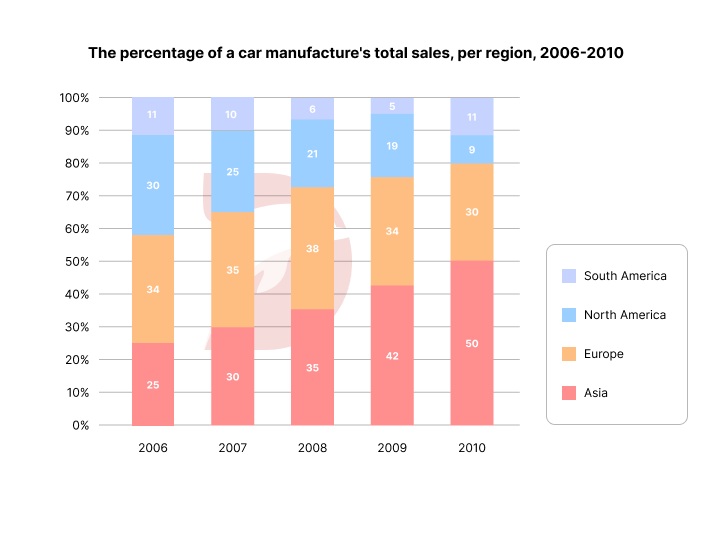
Đề thi IELTS Writing Task 1 ngày 16/03/2024 dạng Bar chart: The chart below shows the percentage of a car manufacturer’s total sales in various regions from 2006 to 2010. Summarise the information by selecting and reporting the main features, and make comparisons where relevant.
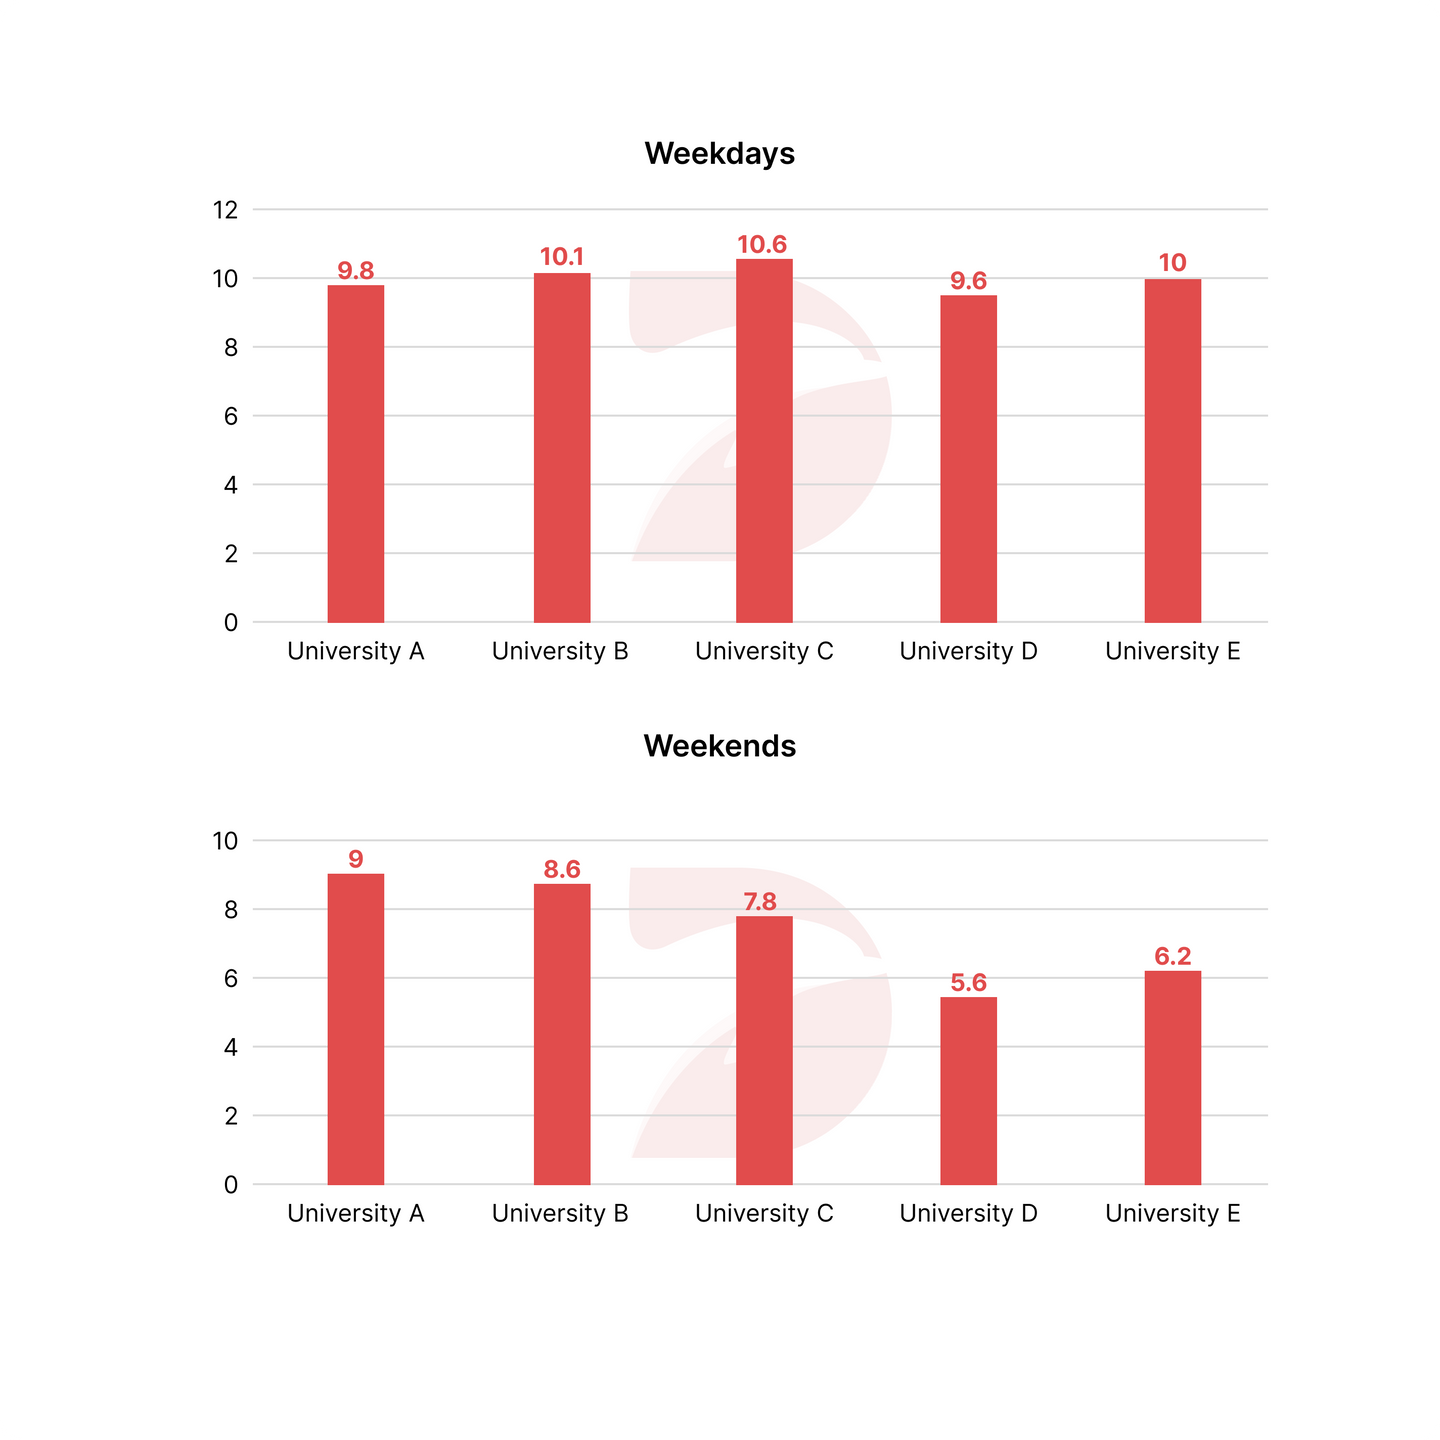
Đề thi IELTS Writing Task 1 ngày 18/04/2024 dạng Bar chart: The bar chart shows the average number of hours students in five different universities studied.
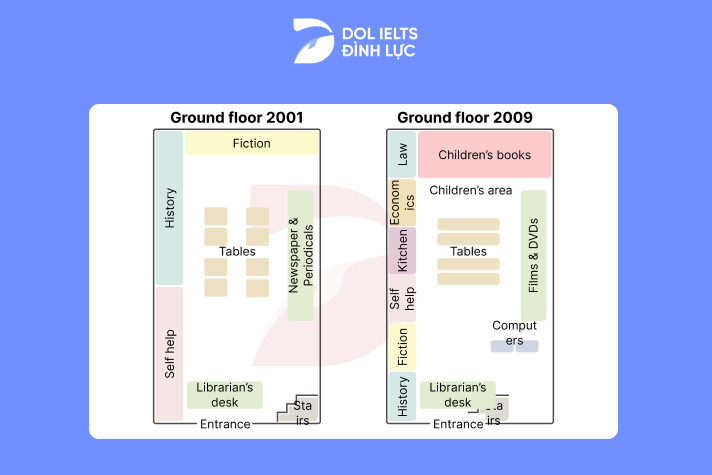
Đề thi IELTS Writing Task 1 ngày 09/03/2024 dạng Map: The plans below show the ground floor of a library in 2001 and how it was developed in 2009. Summarise the information by selecting and reporting the main features, and make comparisons where relevant.