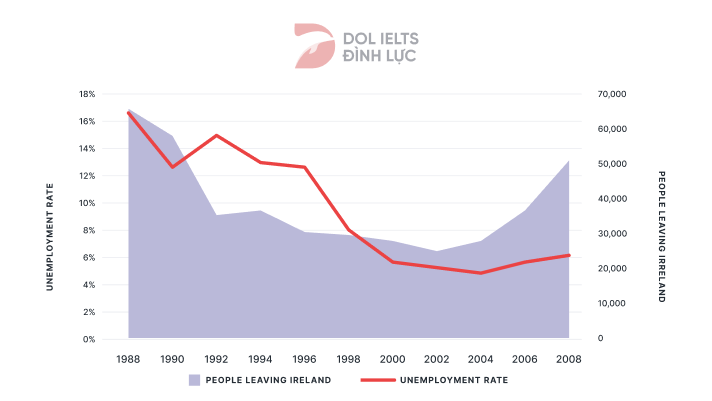
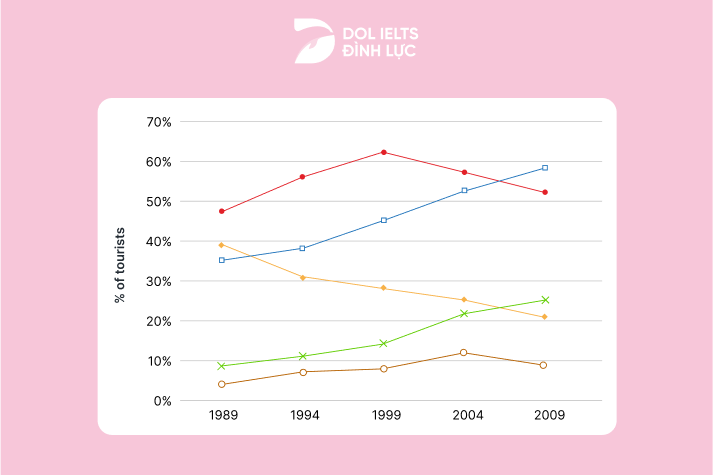
The number of people leaving Ireland from 1988 to 2008
Đề thi IELTS Writing Task 1 ngày 14/09/2019 dạng Line graph: The chart below shows the unemployment rate and the number of people leaving Ireland from 1988 to 2008. Ở bài viết này DOL sẽ viết 1 sample IELTS Writing được 8.0 kèm với 1 số từ vựng và cấu trúc hay trong bài. Chúc các bạn học IELTS vui vẻ cùng dol.vn.

🚀 Đề bài
😵 Dàn ý
DOL sẽ miêu tả biểu đồ với 1 câu mở bài (Intro), 1 đoạn miêu tả tổng quát (Overview), và 2 đoạn thân bài miêu tả chi tiết (Detailed Description)
Mở bài: DOL sẽ paraphrase lại đề bài để giới thiệu lại đề bài cho người chấm
Miêu tả tổng quát: DOL sẽ chỉ ra các đặc điểm quan trọng, nổi bật nhất trong biểu đồ
Thân bài: Vì đây là dạng bài có số liệu thay đổi qua nhiều mốc thời gian, ta sẽ tập trung vào xu hướng tăng giảm của các số liệu
Body 1: Đầu tiên, DOL sẽ phân tích xu hướng di cư của người dân Ireland
Body 2: Tiếp đến, DOL sẽ mô tả xu hướng tăng giảm của tỷ lệ thất nghiệp
- In 1988, approximately 65,000 people decided to leave Ireland --> Hit a low of 35,000 emigrants --> Fluctuated in a downward trend to a trough of 25,000 people in 2002
- The figure started to recover, climbing up to 55,000 people
- Stood at 17% in 1988 --> Underwent a sudden decline of 5% --> Peaked at 15%
- Kept dropping down to a low of 6% in 2000 and another low of 5% in 2004
- Witnessed a very moderate recovery back to 6% in 2008
📝 Bài mẫu
The line graph
A glance at the graph shows that despite the
In 1988, approximately 65,000 people decided to leave Ireland. This number
As for unemployment rate, it stood at 17% in 1988 and thereafter underwent a sudden decline of 5% in 1990. Having
(183 words)
📚 Vocabulary


✨ Bài tập Exercise
Mình cùng làm 2 bài tập sau đây để ôn lại các từ vựng và cấu trúc đã được dùng trong bài Sample nhé!
Exercise 1:
Điền các từ/cụm từ phù hợp vào chỗ trống (dựa vào danh sách từ vựng phía trên)
Dao động theo xu hướng giảm
=>
Trải qua một sự suy giảm đột ngột
=>
Chạm mốc cao nhất ở 15%
=> Peak
=> Reach a peak
Giảm mạnh
=> Go down
Mức thấp nhất ở 25,000 người
=> A
Theo xu hướng thất thường
=> Follow
Exercise 2:
1 Điều kiện sống tồi tệ của quốc gia này đã dẫn tới sự giảm sút về số lượng cư dân.
=> The poor living conditions of the country has resulted in
2 Tỷ lệ thất nghiệp đã gia tăng trong nhiều tháng.
=>
3 Sự giảm sút liên tục trong số lượng các loài quý hiếm cần được chú ý tới nhiều hơn.
=>
4 Mặc dù có sự sụt giảm liên tục trong số lượng cư dân, nó vẫn tăng trở lại khi càng về cuối giai đoạn.
=> Despite the continual decline in the number of residents, it still
Ôn bài mẫu cùng ngày IELTS Writing Sample task 2 ngày 14/09/2019 và ôn tập từ vựng đi kèm.
Đề writing hay nhất tháng 09/2019.
Bấm vào trang Tổng hợp những bài mẫu IELTS Writing để tham khảo thêm các bài văn mẫu Writing Task 1 IELTS khác nữa nhé.
💡 Lời kết
Tới đây là hết rồi  Sau sample "The chart below shows the unemployment rate and the number of people leaving Ireland from 1988 to 2008" vừa rồi, DOL mong các bạn không chỉ nắm được cách trả lời cho dạng bài Line graph, mà còn học được những từ vựng và cấu trúc hay để miêu tả các biểu đồ tương tự nhé.
Nếu có thời gian thì nhớ làm phần bài tập và tự mình viết một bài khác nha vì 'Practice makes perfect' mà nhỉ? DOL chúc các bạn học tốt! 
Bài viết khác
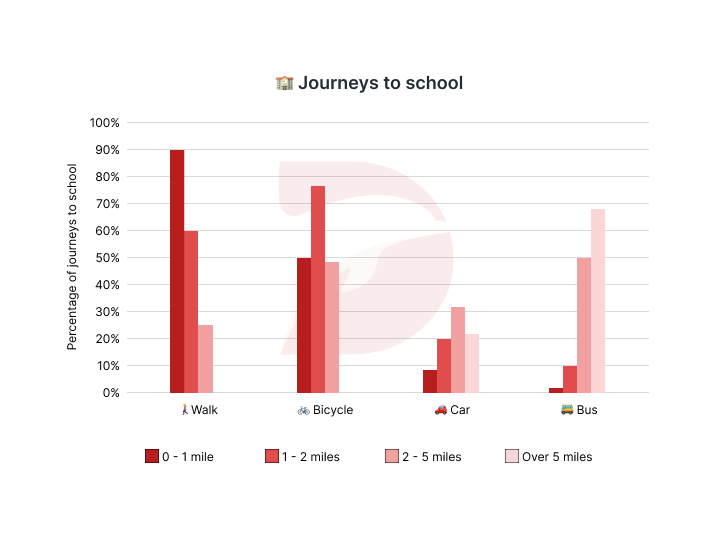
Đề thi IELTS Writing Task 1 ngày 13/04/2024 dạng Bar chart: The chart below gives information about the journeys to school by children aged 11 to 16 in the UK in a year. Summarise the information by selecting and reporting the main features, and make comparisons where relevant.
Đề thi IELTS Writing Task 1 ngày 06/04/2024 dạng Bar chart: The two bar charts show the proportion of 14 - 16 year-old students studying a modern foreign language in an English-speaking country, and the top three popular foreign languages. Summarize the information by selecting and reporting the main features, and make comparisons where relevant.
Đề thi IELTS Writing Task 1 ngày 03/02/2024 dạng Line graph: The graph below shows the percentage of Australian export to four countries from 1990 to 2012. Summarise the information by selecting and reporting the main features, and make comparisons where relevant.
Đề thi IELTS Writing Task 1 ngày 09/03/2024 dạng Map: The plans below show the ground floor of a library in 2001 and how it was developed in 2009. Summarise the information by selecting and reporting the main features, and make comparisons where relevant.
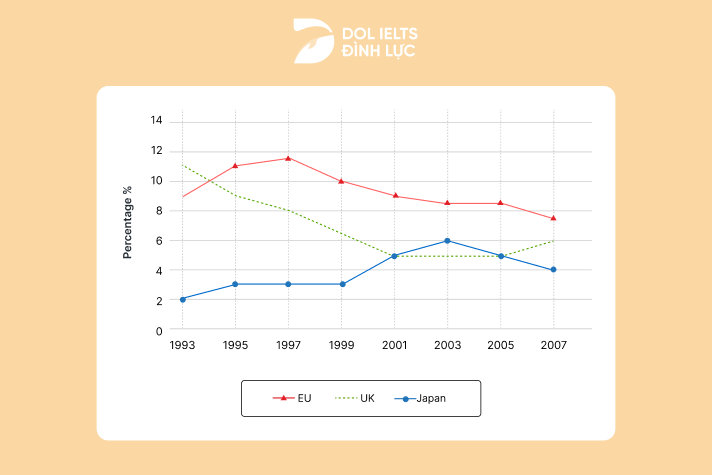
Đề thi IELTS Writing Task 1 ngày 24/02/2024 dạng Line graph: The graph below shows the unemployment rates for the United Kingdom, the rest of Europe, and Japan from 1993 to 2007.