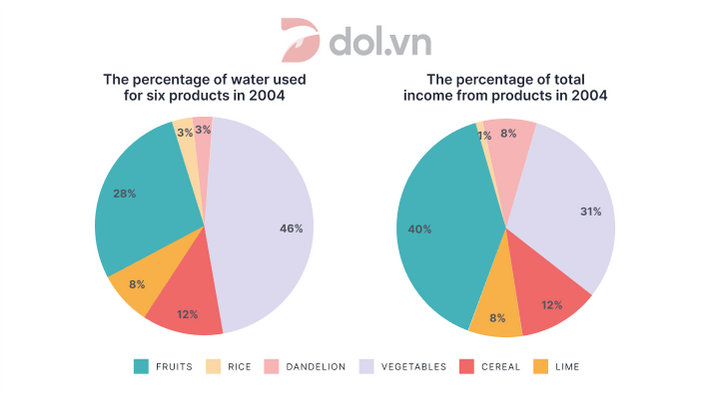
Proportion of water used for 6 products and total income generated from them
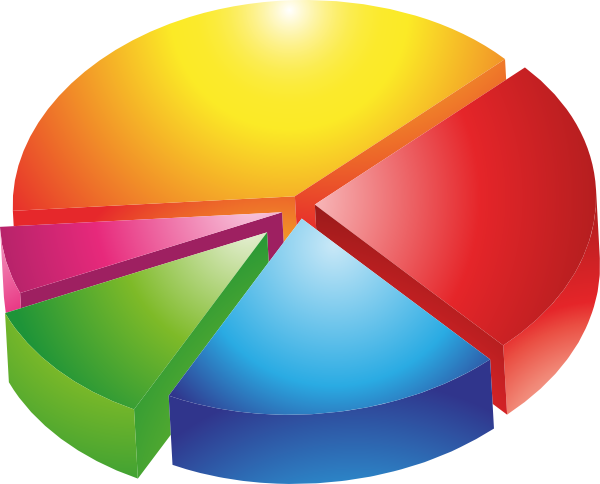
Đề thi IELTS Writing Task 1 ngày 05/06/2021 dạng Pie chart: The chart illustrates the proportion of water used for 6 products and the percentage of total income generated from these products in the same year. Ở bài viết này DOL sẽ viết 1 sample IELTS Writing được 8.0 kèm với 1 số từ vựng và cấu trúc hay trong bài. Chúc các bạn học IELTS vui vẻ cùng dol.vn.

🚀 Đề bài
😵 Dàn ý
DOL sẽ miêu tả biểu đồ với 1 câu mở bài (Intro), 1 đoạn miêu tả tổng quát (Overview), và 2 đoạn thân bài miêu tả chi tiết (Detailed Description)
Mở bài: DOL sẽ paraphrase đề bài để giới thiệu lại đề bài cho người chấm
Miêu tả tổng quát: DOL sẽ chỉ ra các đặc điểm quan trọng, nổi bật nhất trong biểu đồ
Thân bài: Vì đây là dạng số liệu rơi vào một mốc thời gian cố định, ta sẽ tập trung so sánh sự cao thấp ở số liệu giữa các hạng mục trong biểu đồ
Body 1: DOL mô tả biểu đồ thứ nhất
Body 2: DOL mô tả biểu đồ thứ hai
- Vegetables - 46%
- Fruits - 28%
- Cereal - 12%
- Lime - 8%
- Rice and dandelion - %
- Fruits - 40%
- Vegetables - 31%
- Cereals - 12%
- Lime and dandelion - 8%
- Rice - 1%
📝 Bài mẫu
The first given chart illustrates how much water was used for six
Overall, it can be seen that vegetables and fruits used the most amount of water and were also the most
Regarding the amount of water consumed, vegetables led at 46%, which was the highest percentage, followed by fruits at 28% and cereal at 12%. Lime consumed slightly less water than cereal,
In terms of income, fruits were the most profitable, at 40%. This is followed by vegetables, which generated 31%. In addition, 12% of the total revenue was made by cereal. The income
(166 words)
📚 Vocabulary


✨ Bài tập Exercise
Mình cùng làm 2 bài tập sau đây để ôn lại các từ vựng và cấu trúc đã được dùng trong bài viết mẫu IELTS Task 1 nhé!
Exercise 1:
Which is the synonym for 'merely'?
purely
0% chọn
significantly
0% chọn
only
0% chọn
Which is the synonym for 'to constitute'?
Which is the synonyms for 'Additionally'?
Exercise 2:
Điền các từ/cụm từ phù hợp vào chỗ trống
Các hạng mục
=>
Tạo ra lợi nhuận
=> To
Một dự án có thể sinh lãi
=> A
Đóng góp ít nhất vào lượng lợi nhuận tổng
=>
Làm đề thi cùng ngày Writing task 2 IELTS ngày 05/06/2021 và từ vựng đi kèm thường dùng.
Tổng hợp đề thi thật Writing task 1 tháng 06/2021.
Theo dõi dolenglish.vn để cập nhật các bài mẫu Writing IELTS hay và mới nhất.
💡 Lời kết
Tới đây là hết rồi  Sau sample The chart illustrates the proportion of water used for 6 products and the percentage of total income generated from these products in the same year vừa rồi, DOL mong các bạn không chỉ nắm được cách trả lời cho dạng bài Pie chart, mà còn học được những từ vựng và cấu trúc hay để miêu tả các biểu đồ tương tự nhé.
Nếu có thời gian thì nhớ làm phần bài tập và tự mình viết một bài khác nha vì 'Practice makes perfect' mà nhỉ? DOL chúc các bạn học tốt! 
Bài viết khác
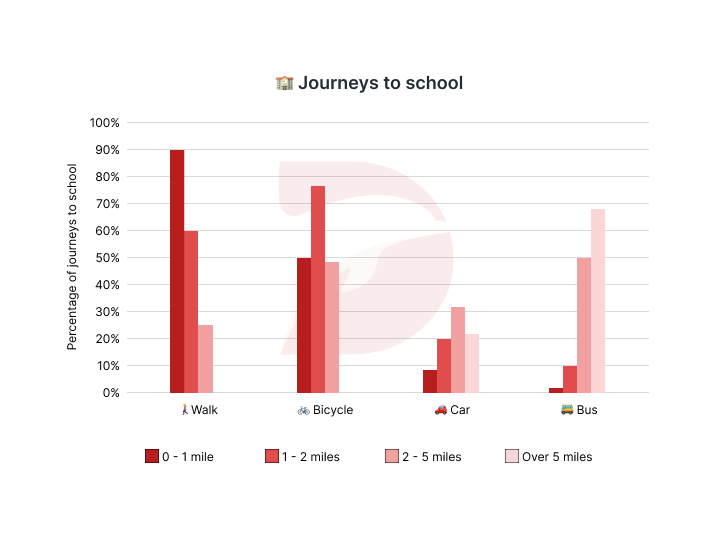
Đề thi IELTS Writing Task 1 ngày 13/04/2024 dạng Bar chart: The chart below gives information about the journeys to school by children aged 11 to 16 in the UK in a year. Summarise the information by selecting and reporting the main features, and make comparisons where relevant.
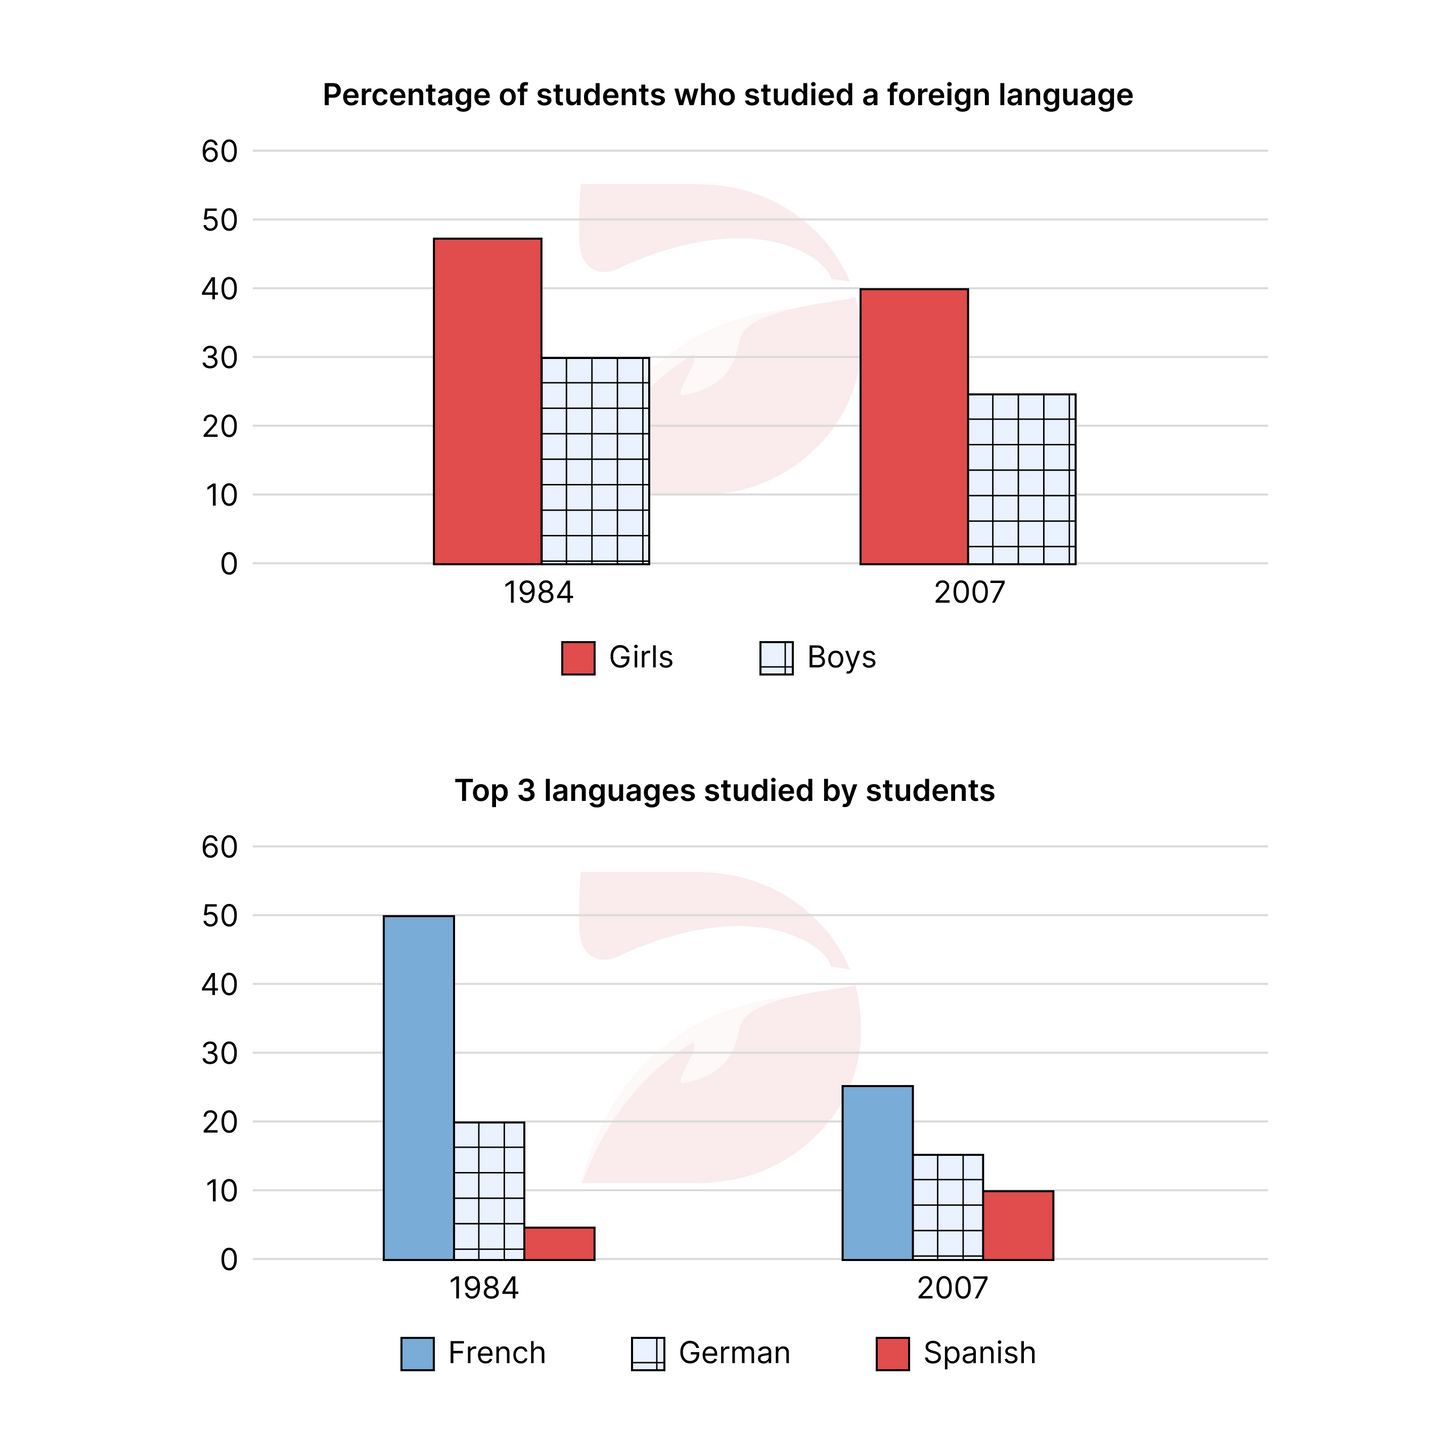
Đề thi IELTS Writing Task 1 ngày 06/04/2024 dạng Bar chart: The two bar charts show the proportion of 14 - 16 year-old students studying a modern foreign language in an English-speaking country, and the top three popular foreign languages. Summarize the information by selecting and reporting the main features, and make comparisons where relevant.
Đề thi IELTS Writing Task 1 ngày 03/02/2024 dạng Line graph: The graph below shows the percentage of Australian export to four countries from 1990 to 2012. Summarise the information by selecting and reporting the main features, and make comparisons where relevant.
Đề thi IELTS Writing Task 1 ngày 27/01/2024 dạng Line graph: The graph below shows the production levels of the main kinds of fuel in the UK between 1981 and 2000. Summarise the information by selecting and reporting the main features, and make comparison where relevant.
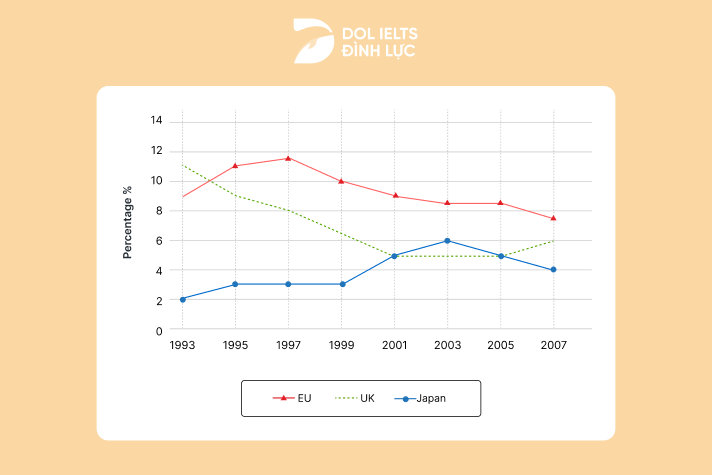
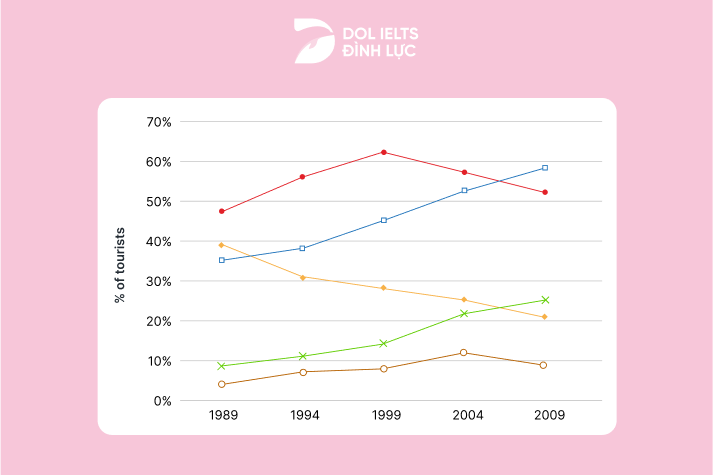
Đề thi IELTS Writing Task 1 ngày 24/02/2024 dạng Line graph: The graph below shows the unemployment rates for the United Kingdom, the rest of Europe, and Japan from 1993 to 2007.